In the most recent federal data, 86.7% of U.S. women and 74.9% of men did household activities on an average day in 2025, and women averaged 2.38 hours a day on them against 1.58 hours for men (BLS American Time Use Survey, Table 1, 2025). Among U.S. working parents in different-sex couples where both work full time, 43% say the mom does more of the household chores, 17% say the dad does, and 40% say it is about equal (Pew Research Center, survey of March 2 to 15, 2026).
This page collects the figures most often requested about how couples divide housework and the thinking behind it. Every number below comes from a source we opened and read on the date of compilation, November 5, 2026. The link beside each figure goes to that source. We did not round beyond what the source publishes, and where we did arithmetic ourselves, we say so.
Key findings in short sentences
Each sentence below can stand alone. The sections that follow give the exact population and the limits.
- In 2025, 47.9% of U.S. women and 23.8% of men did housework on an average day (BLS Table 1).
- In 2025, women averaged 0.91 hours a day on food preparation and cleanup; men averaged 0.51 hours (BLS Table 1).
- In marriages where both spouses earn about the same, wives spent 4.6 hours a week on housework, about 2.5 hours more than husbands (Pew, 2023).
- Among dual full-time working parents in 2026, 49% of dads and 26% of moms were satisfied with the division of household chores (Pew, 2026).
- Among those same moms, 54% who share chores about equally were satisfied, against 11% who say they do more (Pew, 2026).
- In a 2023 survey of 3,000 U.S. parents, mothers reported being mostly responsible for 71% of 21 cognitive household tasks, and fathers for 45% (Weeks and Ruppanner, Journal of Marriage and Family).
How we chose sources, and what the limits are
We used three kinds of evidence, and they answer different questions.
- Time diaries. The American Time Use Survey (ATUS) asks people what they did yesterday. It is the best public measure of hours, but it describes individuals and not couples.
- Opinion surveys of couples. Pew Research Center and Gallup ask people who does more. These capture how a split is perceived, and partners often report it differently.
- Peer-reviewed studies of cognitive work. These use interviews or task batteries to study the planning that a time diary cannot see.
Four limits apply across this page.
- Most data is about different-sex couples. Several sources say so directly, and we note it at each figure. Findings on same-sex couples are limited here to one Pew report.
- Most of it is American. This page does not summarize other countries.
- Sources are not directly comparable. They differ in year, population and question wording. Do not add or average them.
- Correlation is not cause. The satisfaction figures show that two things go together. They do not show that one caused the other.
What does federal time-use data say about housework?
The Bureau of Labor Statistics publishes the ATUS. The latest release came out on June 25, 2026, and covers 2025 annual averages. All figures in this list come from Table 1, which covers the civilian population age 15 and over. Hours per day are averages across everyone in the group, including people who did none of that activity on the day.
- All household activities: 86.7% of women and 74.9% of men took part on an average day. Women averaged 2.38 hours and men 1.58 hours.
- Housework: 47.9% of women and 23.8% of men. Women averaged 0.81 hours and men 0.30 hours.
- Food preparation and cleanup: 72.2% of women and 57.9% of men. Women averaged 0.91 hours and men 0.51 hours.
- Household management: 22.6% of women and 14.4% of men. Women averaged 0.22 hours and men 0.12 hours.
- Lawn and garden care: 8.9% of women and 11.2% of men. Women averaged 0.13 hours and men 0.26 hours.
- Caring for and helping household members: 24.7% of women and 19.2% of men. Women averaged 0.61 hours and men 0.36 hours.
- Purchasing goods and services: 42.6% of women and 36.6% of men. Women averaged 0.77 hours and men 0.61 hours.
By our subtraction, the gap in household activities is 0.80 hours a day, which is 48 minutes. BLS does not publish that difference as a figure in Table 1.
On the days people did household activities at all, women averaged 2.75 hours and men 2.11 hours (BLS Table 1). So the gap has two parts: more women do this work on a given day, and those who do it spend longer on it.
For comparison, in the 2024 data, 87% of women and 74% of men spent some time on household activities on an average day. The same release's Table 1 gave 48.5% of women and 24.9% of men for housework. We have not tested whether changes from 2024 to 2025 are statistically significant, so do not read them as a trend.
Does the gap change when there are children or jobs?
The gap appears in every group shown in the two BLS tables below. These tables cover adults 18 and over, and they describe men and women in households with or without children, not two partners in the same couple.
All adults, average hours per day in 2025 (BLS Table 8A):
- Household activities, with a child under 18 at home: women 2.56, men 1.51.
- Household activities, no child under 18 at home: women 2.42, men 1.69.
- Caring for and helping household children, youngest child under 6: women 2.56, men 1.53.
- Caring for and helping household children, youngest child 6 to 17: women 0.81, men 0.38.
Employed adults only, average hours per day in 2025 (BLS Table 8B):
- Household activities, with a child under 18 at home: women 2.00, men 1.45.
- Household activities, no child under 18 at home: women 1.93, men 1.36.
- Caring for and helping household children, child under 18 at home: women 1.22, men 0.78.
What do couples say about who does more?
Pew's newest figures come from a survey of U.S. working parents conducted March 2 to 15, 2026. These figures cover married or cohabiting different-sex couples in which both parents work full time.
- Household chores: 43% say the mom does more, 17% say the dad does more, 40% say about equal.
- Day-to-day parenting tasks: 52% say the mom does more, 10% say the dad does more, 39% say about equal.
- When the mom spends more time on paid work: 38% say the mom still does more of the chores, 22% say the dad does more, 39% say about equal.
- Unexpected time off when child care falls through: 48% say the mom would be more likely to take it, 22% say the dad, 29% say equally likely.
A note on this source: the Pew page gives its sample size as 2,242 in one place and 2,422 in another. We have not resolved this, so check the page before citing a sample size.
Pew's survey of October 13 to 19, 2020, with 10,332 U.S. adults in total, shows how much the answer depends on who you ask. These figures cover married or cohabiting adults in opposite-sex couples.
- 59% of women said they do more of the household chores, and 6% said their partner does more.
- 20% of men said they do more, 34% said their partner does, and 46% said it is about equal.
- 74% of mothers said they do more to manage their children's schedules and activities, and 3% said their partner does.
Gallup's 2019 survey of 3,062 married or cohabiting heterosexual adults, published January 29, 2020, breaks the split down by task.
- Mostly the woman: laundry 58%, house cleaning 51%, preparing meals 51%.
- Mostly the man: car maintenance 69%, yard work 59%.
- Close to even: paying bills, 37% the woman and 34% the man.
- Reported differently by each side: 59% of women and 43% of men said the woman is more likely to clean the house. For dishes, it was 50% of women and 34% of men.
Those last two figures matter. Two people in the same kind of household can honestly describe the same work differently.
Does earning the same change the split?
It narrows some gaps and leaves others. Pew reports that the share of opposite-sex marriages in which each spouse earns 40% to 60% of the couple's combined income rose from 11% in 1972 to 29% in 2022. Pew calls these egalitarian marriages.
Average hours per week from that report's analysis of the American Time Use Survey:
- Egalitarian marriages: wives spend 4.6 hours on housework, about 2.5 hours more than husbands. Wives spend 6.9 hours on caregiving. Husbands have 25.2 hours of leisure and wives 21.6. Husbands do 44.2 hours of paid work and wives 41.1.
- Husband is the primary earner: wives 7.3 hours of housework, husbands 1.4.
- Husband is the sole earner: wives 10.5 hours of housework, husbands 1.4.
- Wife is the primary earner: wives 4.8 hours of housework, husbands 2.8.
- Wife is the sole earner: Pew reports no significant difference in housework between spouses.
The Pew page we read does not state which years of time-use data it used, and we have not filled that in.
Is the division linked to satisfaction?
Yes, in the surveys, and the pattern is consistent for men and women. In Pew's 2026 survey of dual full-time working parents, 49% of dads and 26% of moms were satisfied with the division of household chores. Among moms, 54% who share chores about equally were satisfied, against 11% who say they do more. Among dads who split chores equally, 61% were satisfied.
Pew's 2019 survey of 9,834 U.S. adults, fielded June 25 to July 8, 2019, used the stronger measure of "very satisfied". Results below are from the report's chapter on how adults see their relationships.
- Married adults: 46% very satisfied with how chores are divided. Cohabiting adults: 37%.
- Married men: 51%. Married women: 40%.
- Women married to or living with a man: 20% of those who say they do more, 65% of those who say their partner does more, 68% of those who say it is about equal.
- Men married to or living with a woman: 19% of those who say they do more, 52% of those who say their partner does more, 63% of those who say it is about equal.
That last pair is the one to remember. People who say they do more are very satisfied at about the same low rate, 20% of women and 19% of men.
For same-sex couples, Pew's January 8 to 19, 2025 survey included 1,154 adults married to or living with a same-sex partner. Of those, 45% were very satisfied with how chores are divided. Pew describes no clear-cut division of labor across cooking, cleaning, fixing things or financial contributions. No task had a majority saying either partner did more.
What does research say about the mental load?
Time diaries record the hour spent at the store. They do not record the week spent noticing that the store was needed. Three studies address that gap.
Daminger (2019). Allison Daminger's article "The Cognitive Dimension of Household Labor", in American Sociological Review 84(4), pages 609 to 633, uses 70 in-depth interviews with members of 35 couples. Its abstract says "cognitive labor entails anticipating needs, identifying options for filling them, making decisions, and monitoring progress." It reports that women do more of this work overall, especially anticipating and monitoring, and that men and women take part in decisions about equally. JSTOR Daily's summary reports that women did more cognitive labor in 26 of the 32 heterosexual couples, across a sample of middle-class and upper-middle-class people. It also reports averages across nine domains: women did more in 4.6, men in 1.6, and 2.2 were shared. The publisher's full text was not available to us, so these details rely on that summary.
Weeks and Ruppanner (2024). "A typology of US parents' mental loads", in Journal of Marriage and Family, surveyed 3,000 U.S. parents of children 18 and younger in February and March 2023, using the survey firm Dynata and quotas to mirror the population of parents. Respondents said who typically does each of 21 cognitive tasks.
- All 21 tasks: mothers said they were mostly responsible for 71%, fathers for 45%.
- 15 daily tasks: mothers 79%, fathers 37%.
- 6 episodic tasks such as repairs and finances: mothers 53%, fathers 65%.
- Own estimate of total share: mothers said 78%, fathers said 61%.
Those figures add up to more than 100% on purpose. The respondents are individual parents and not matched couples, and the authors find that parents overestimate their share, fathers more so. Task by task, 83% of mothers and 37% of fathers said they are mostly the one keeping track of the family calendar. For noticing when a dishwasher or faucet needs repair, 52% of mothers and 69% of fathers said so.
Aviv and colleagues (2024). A study summarized by USC Dornsife, published in Archives of Women's Mental Health, asked 322 mothers of young children about 30 household tasks. Mothers reported doing about 73% of cognitive household labor and about 64% of physical labor. Mothers carrying a larger share of cognitive labor reported more depression, stress, relationship dissatisfaction and burnout. The data was self-reported, from mothers in cohabiting heterosexual couples only, so partners were not asked. We read the university's summary and not the journal's full text.
What these numbers do not tell you
- They do not tell you about your household. An average says nothing about any one couple. Many couples in these surveys split the work evenly, and some have the pattern reversed.
- They do not measure quality or standards. A time diary does not record whether the job needed doing to that standard.
- ATUS does not capture simultaneous work. BLS does not collect secondary activities, except care of children under 13. If someone plans dinner while driving, the diary records only the main activity.
- ATUS is not a sample of couples. One person age 15 or over is randomly chosen from each sampled household. About 6,100 people were interviewed in 2025, by phone, about the previous day (Technical Note). Partners are not interviewed together.
- 2025 has a known gap. BLS suspended ATUS operations in fall 2025, so no data covers September 30 to November 11, 2025. Q4 estimates were weighted to represent the full quarter, and BLS says the effect cannot be quantified.
How to use this data at home
A statistic will not settle who does what in your home, and it tends to start the wrong argument. Your own list works better. Write down what actually happened last week, including the four jobs in every chore: notice, plan, do, follow up. The four jobs are our plain-language way of using this research, and they are not a measure from any study above. Daminger's four parts all sit on the thinking side, while "do" is the physical part.
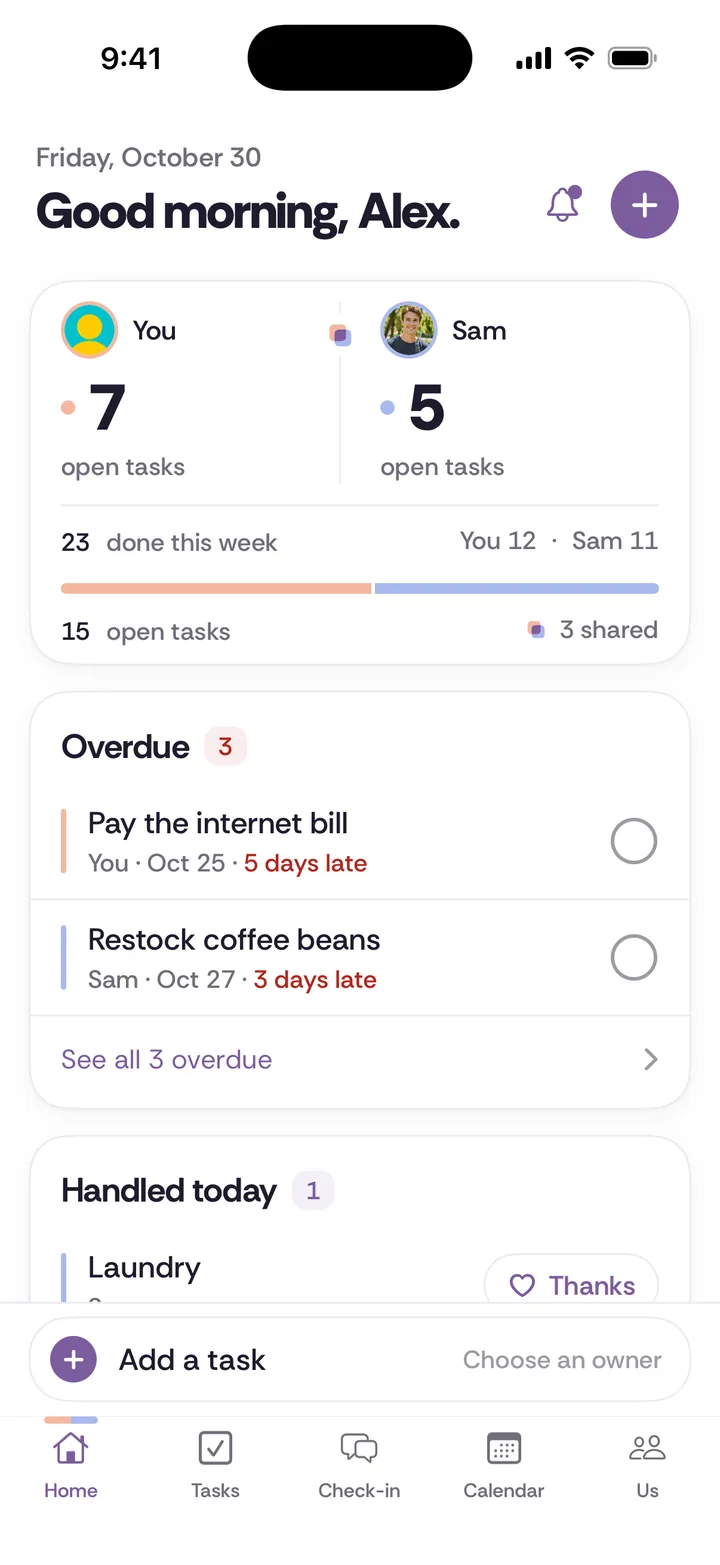
The full list of household chores and the mental load examples can help you build that list. The chore split calculator or worksheet can help you estimate hours. Then use the guide to splitting chores fairly and agree who owns what. Pen and paper is enough. If you want the list to stay with you both, Tiptoe is a free shared app for iPhone and web where each chore repeats on a schedule and has one owner.
How to cite this page
Credit Tiptoe and link the canonical URL: Tiptoe, "Household chores statistics for couples: a data summary (2026)", https://tiptoe.ai/guides/household-labor-statistics/, compiled November 5, 2026. For academic or news use, please cite the original source linked beside each figure. BLS links that end in "atus.t01.htm" point to the latest release and will change when BLS publishes new data, so cite the release year with them.